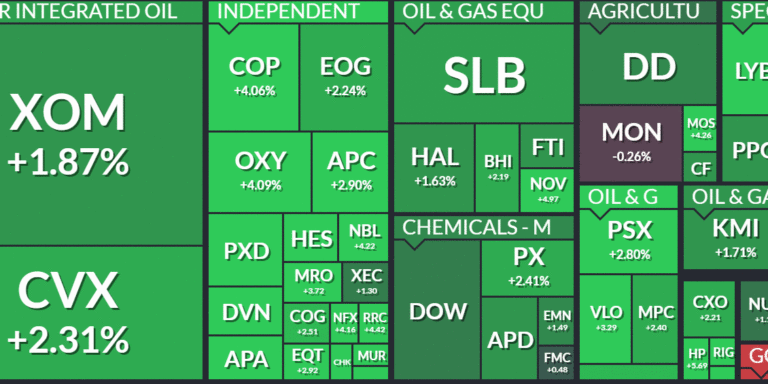
As you know, money rotated radically out of tech on Friday and some of it ended up in the energy space. I don’t get it. Why does the energy heat map look like this (one day gains)?

Basic Materials – 1 day gains
Crude inventories where higher than expected last week and there isn’t any evidence that the world is going to curb production (they need to). For now, it’s not likely that I’ll participate in the Friday buy-up.
From Ivesting.com
Despite posting a gain on Friday, crude futures struggled to pare losses sustained earlier in the week, after U.S. crude stockpiles unexpectedly swelled while oversupply concerns resurfaced as investors braced for an uptick in Nigerian and Libyan output.
Output in both Nigeria and Libya came into focus this week, as key oilfields in both countries are set to resume production. Both countries are exempt from the Opec production curbs.
National Oil Corp said on Friday, Libya’s 270,000-bpd Sharara oilfield has reopened after a workers’ protest and should return to normal production within three days.
Royal Dutch Shell on Wednesday, lifted force majeure on exports of Nigeria’s Forcados crude oil, bringing all of the West African country’s oil exports fully online for the first time in 16 months.
Investors fear that rising global output, threatens to derail Opec and its allies’ plans to curb inventories to the five-year average.
If you take a look at the XLE daily, the downtrend is still intact. EMA23 is the current ceiling with SMA50 just above. If XLE can test SMA50, I might look for a spec trade, but I think there are better sectors to watch headed into the middle of June.


