Gold has been rampaging higher lately as global growth slows, Trump tries to plays playground bully with China, and interest rates turn south.
As you can see in the chart below, the real push in GLD started in June. Volume increased and GLD moved strongly out of consolidation. This would have been the best time to enter long, obviously, but is it too late jump on the gold train?
From a daily view, there isn’t an obvious entry right now. I tend to buy strong up-trends on pullbacks to ema23 if it holds. Even better, I would like to see it pull back to the 131-135 range. If this happens, it’s likely that the equities market is doing pretty well and my interest in GLD has decreased.
If you look at a much longer time frame (weekly chart), GLD is currently at resistance.
With the daily showing GLD a little extended and the weekly representing resistance, my plan this week will be to wait and see if a more reasonable opportunity presents itself lower.
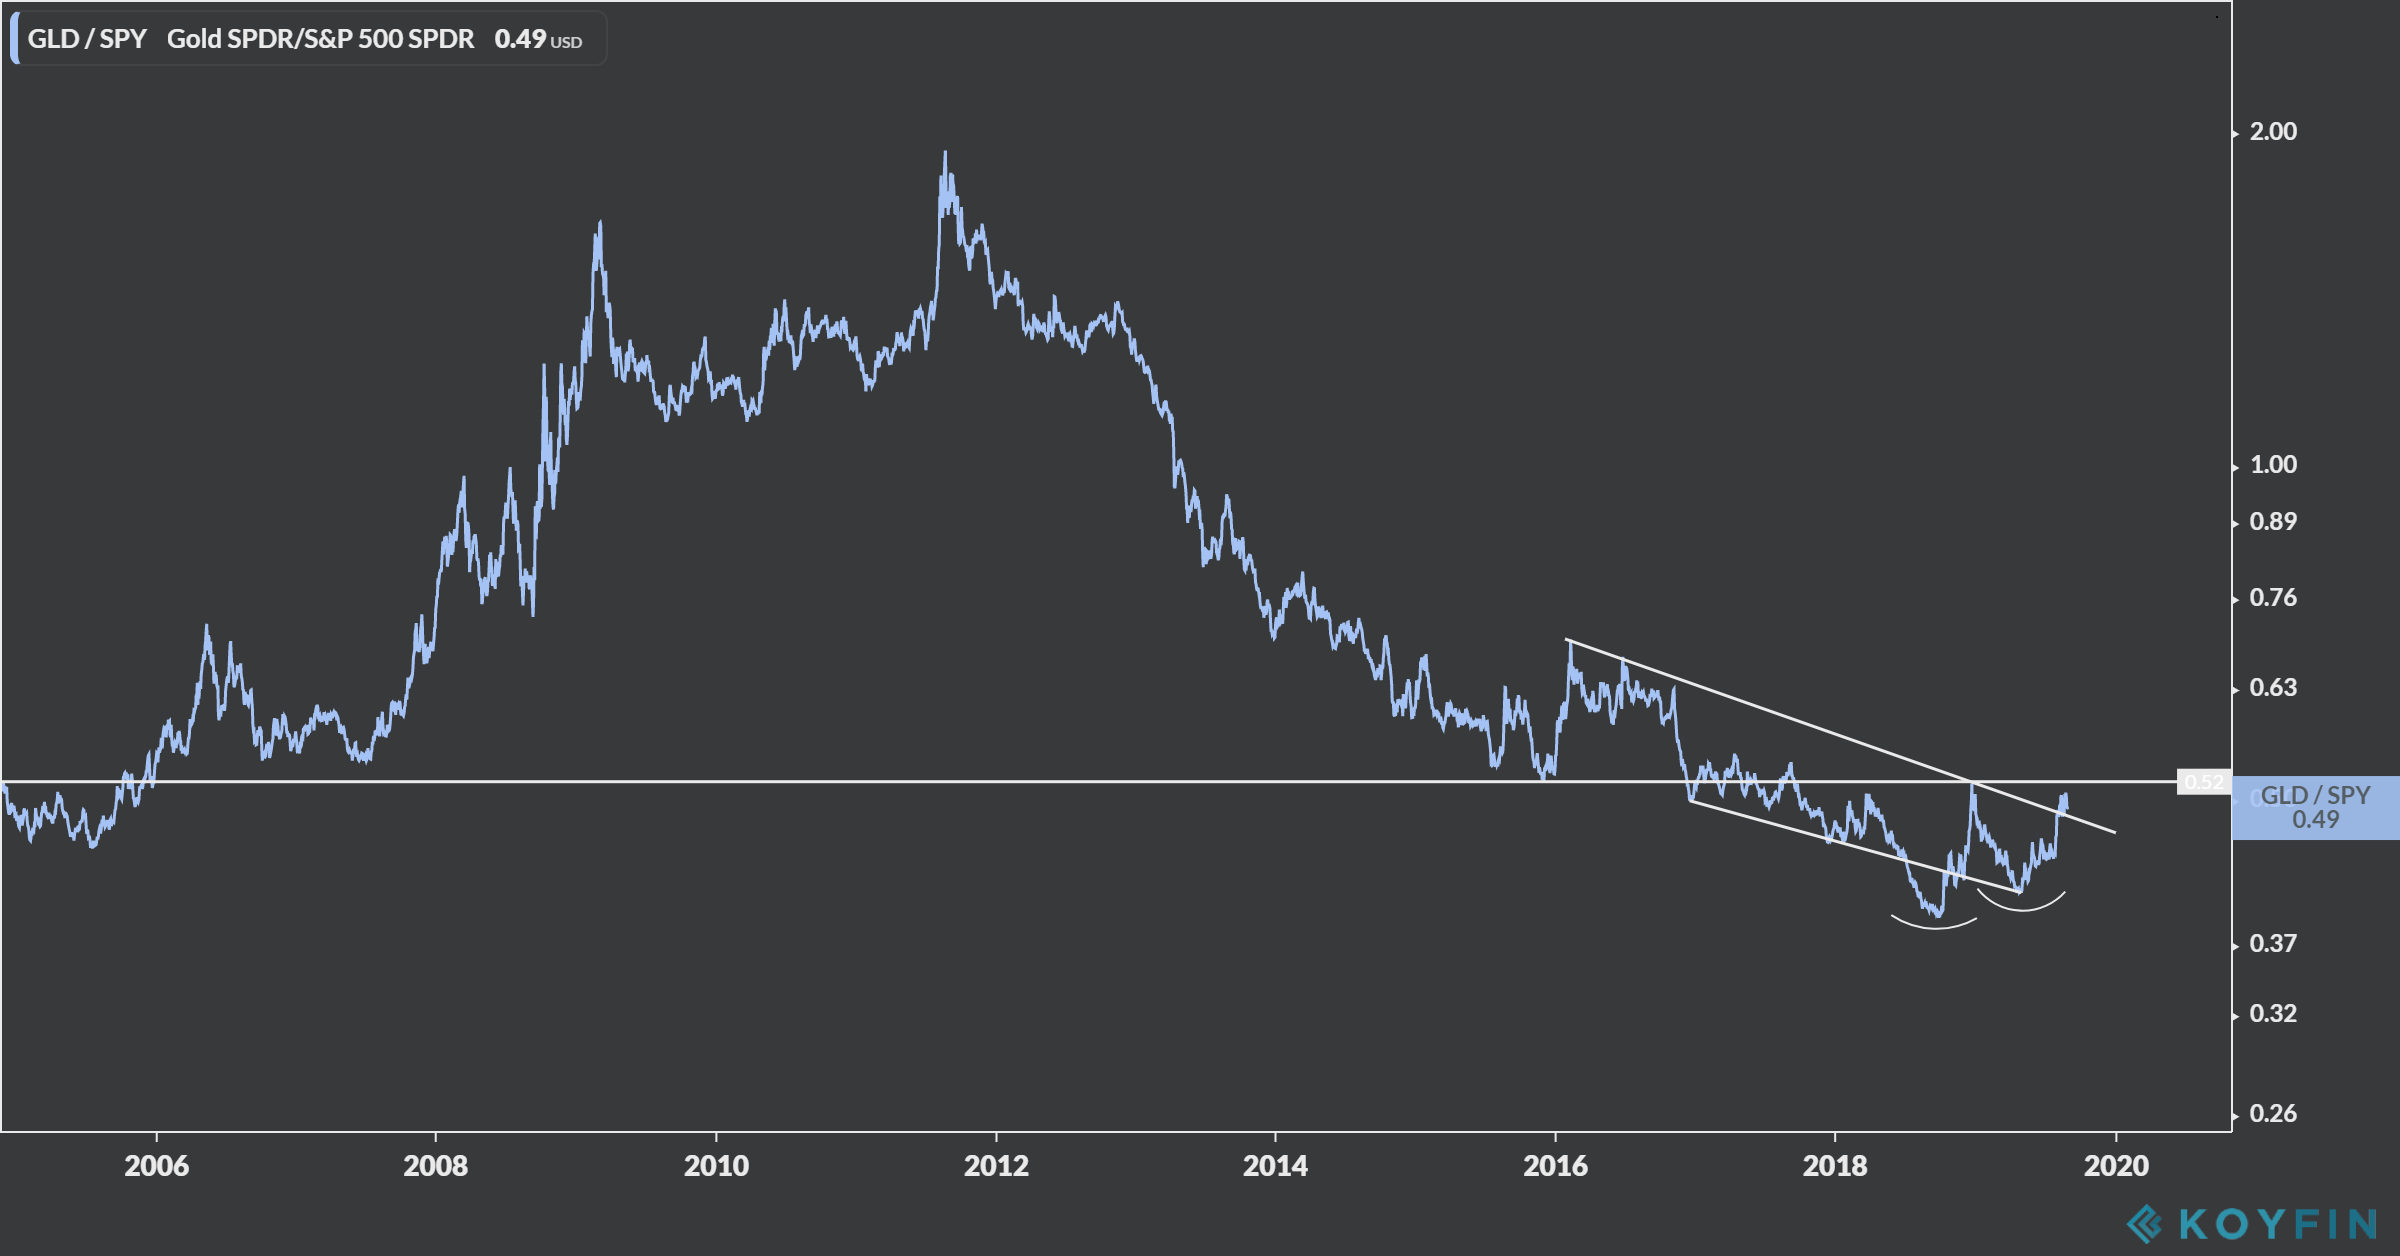
One more chart of interest. The GLD:SPY ratio. This is one of those “damn, I should buy gold now” charts. The huge bull run back in late 2008-2013 is pretty well displayed in the GLD:SPY ratio chart. You can clearly see the GLD interest boom to nearly a 2x SPY by the beginning of 2012. Since then, GLD has generally fallen out of favor… until now (June). The question will be if gold starts creating ratio numbers like it did back in 2009. If so, gold could go on an epic, long-term run. Because of this, I’ve been sitting on some GLD with no intentions to sell anytime soon. However, I’m not adding here until I see the next leg of conviction.
In the chart below, the GLD:SPY ratio is starting to create an attractive bottoming pattern (W pattern). If the horizontal line is broken to the upside, I’ll add to my position.


