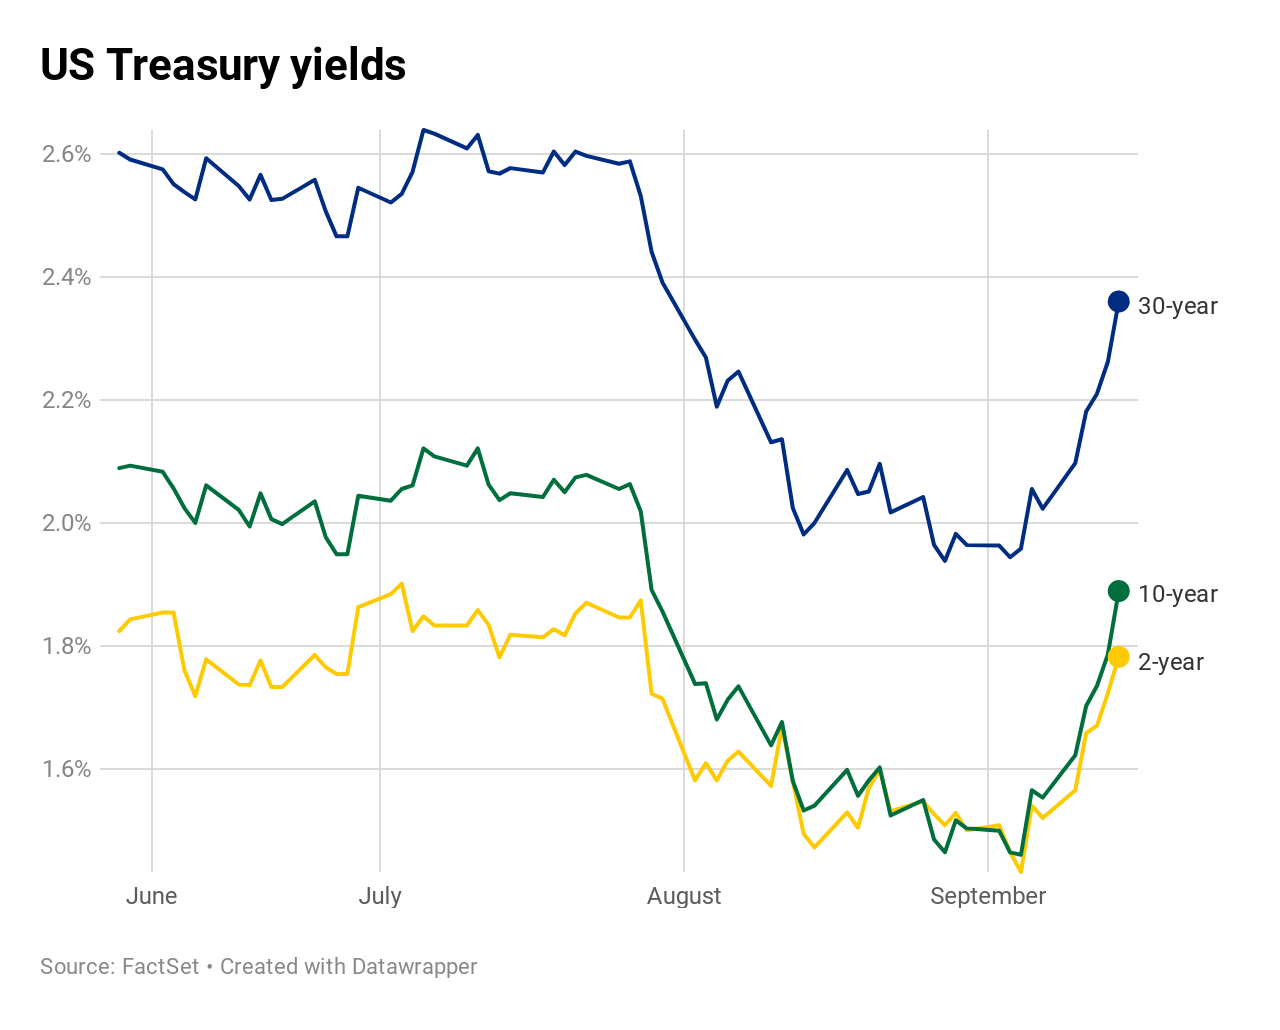
OK, so traders love to go guardrail to guardrail and chase shiny objects. Last week’s shiny object was the equities market (DOW up 8 days in a row) which resulted in a spike in the bond yields.

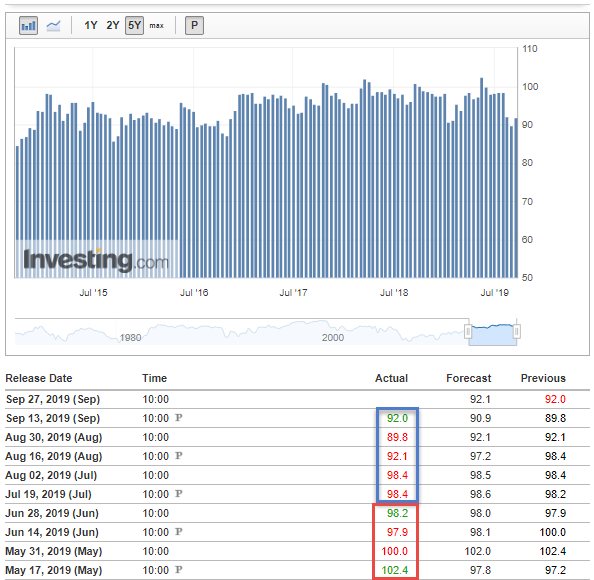
The equities market was bolstered largely by CoreCPI and Consumer Sentiment – those darn consumers continue to save the day. But, if you look at the numbers, there really isn’t much to be excited about other than another week of recession avoidance.
Consumer Sentiment is in a downtrend even with the slight bump on the 13th.

U.S. Michigan Consumer Sentiment
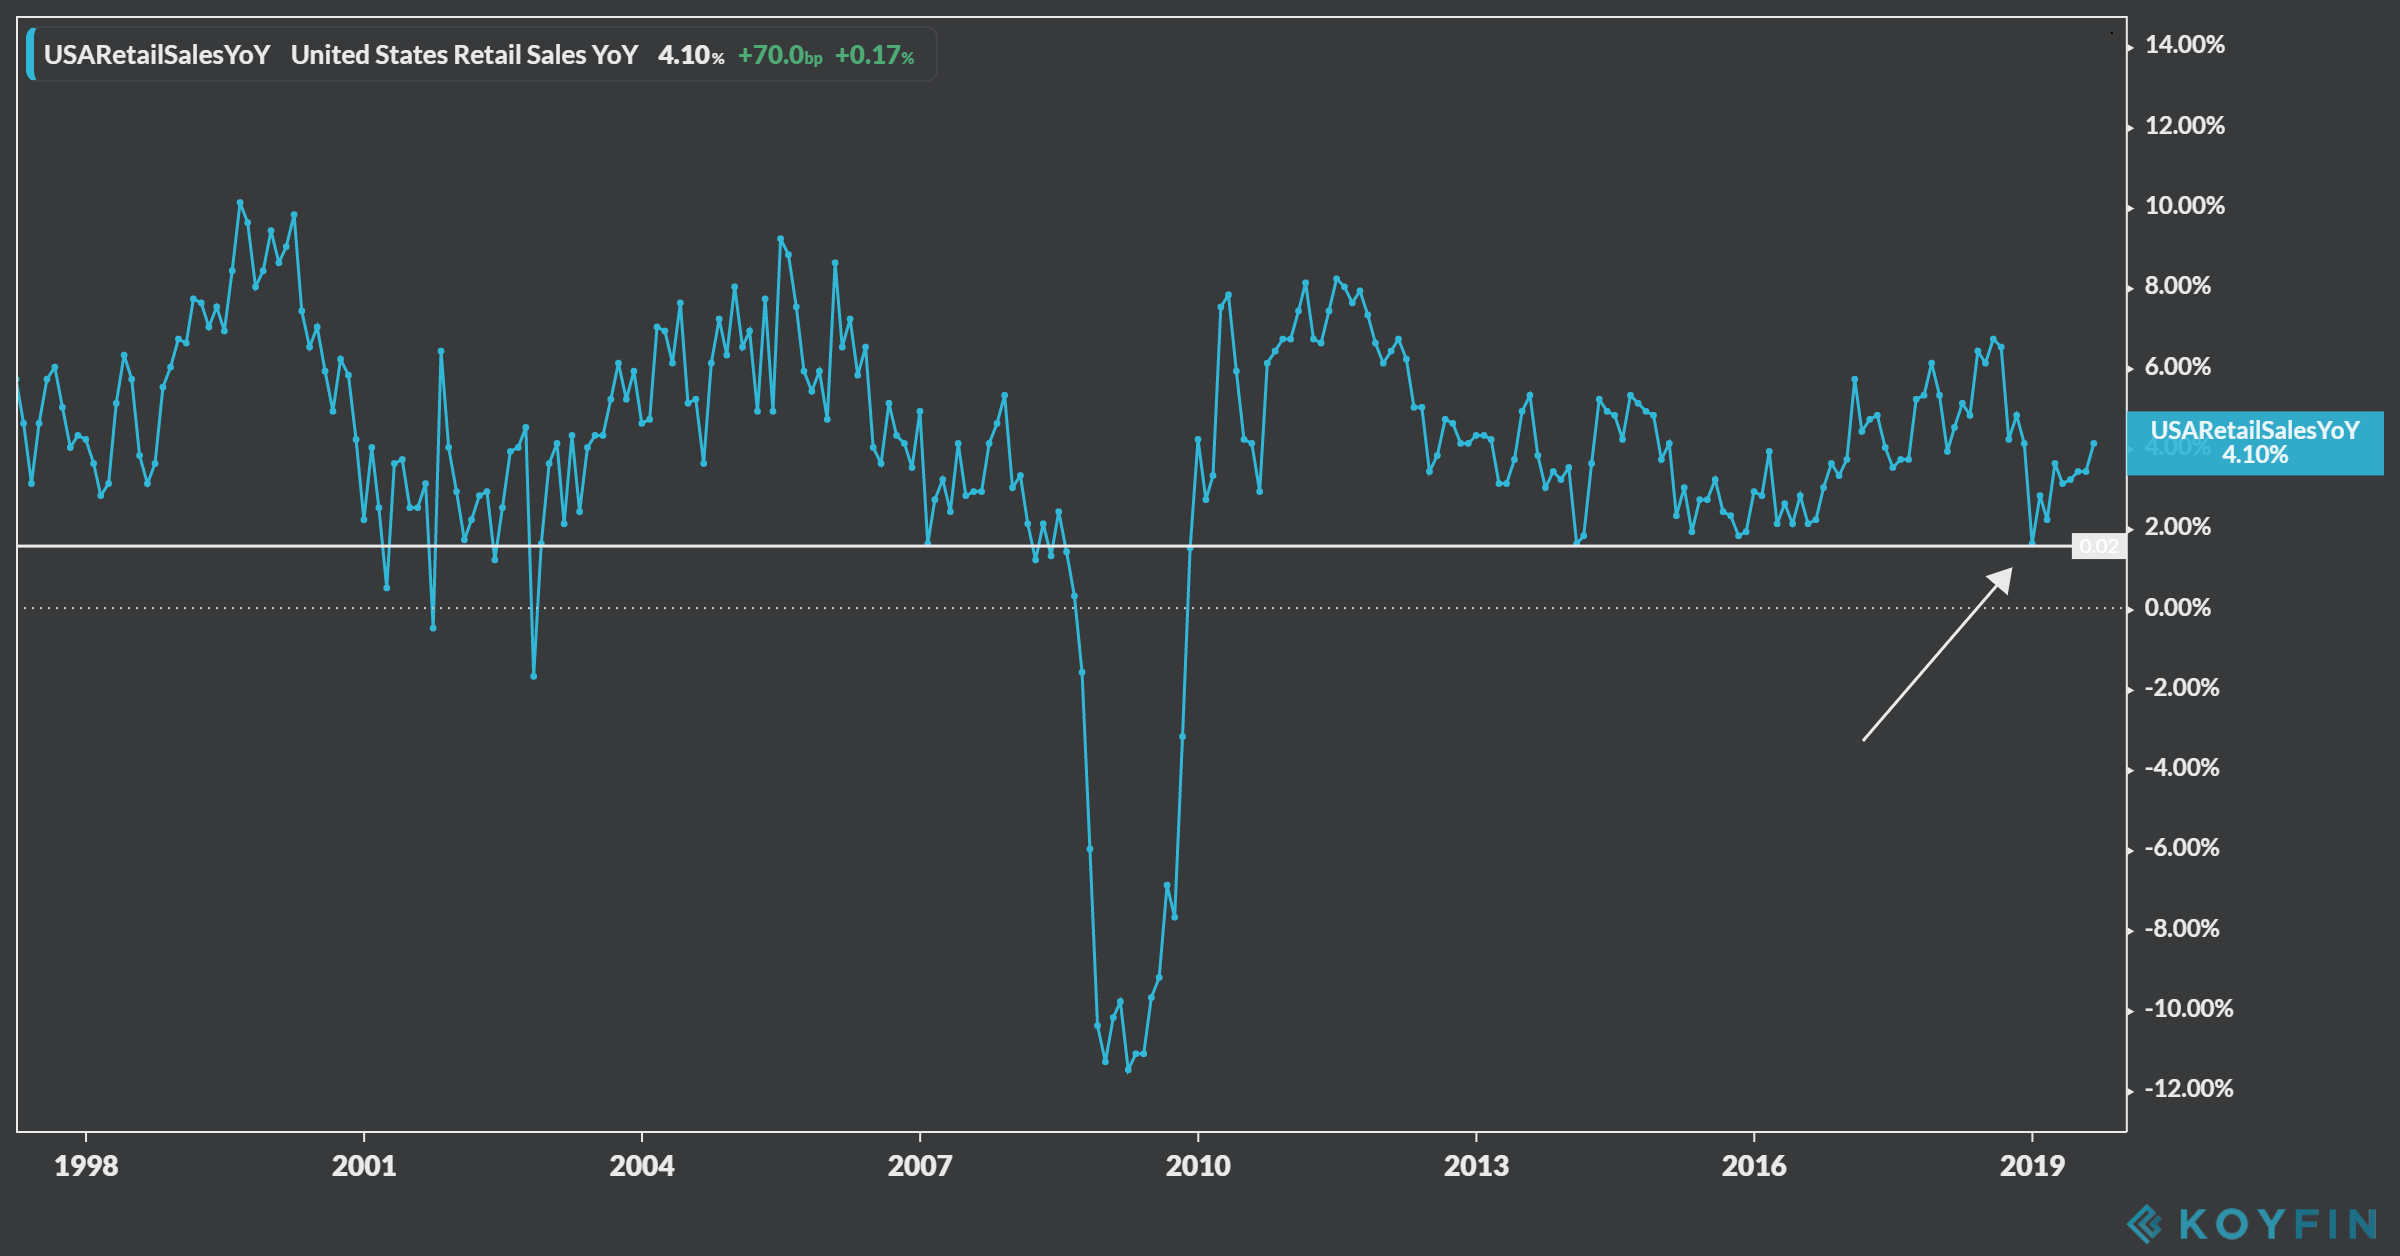
The YoY Retail Sales numbers are also interesting. We bounced off support in January just when it looked like the market was falling off the cliff. Since then, numbers have been trending up and are not too worrisome.
Despite the somewhat positive news, there is one chart that may support the narrative that concern is starting to creep its way into the market.
The chart I’m talking about is the TLT:SPY ratio. As you can see, the ratio has been in a general downtrend since our last recession (hello longest bull market in history). However, over the last 6+ months, things have become a little more choppy and a possible bottoming pattern has emerged. If the ratio breaks out of this wedge to the upside and tests horizontal resistance just above, the equities market may be in trouble.
$TLT:$SPY ratio printing higher lows this year, but we’re not in a bearish place yet. I’m watching to see if the ratio solidly gets outa this wedge and threatens horizontal resistance line. Last week ‘saved’ the ratio temporarily. pic.twitter.com/ki5vVvNVql
— ryan 🦏 (@ryanmathews) September 14, 2019


