401k Investment options for 2018.
NOTE: this is not a recommendation to buy or sell.
Target Date Funds
The further out the target date (based on when you’re hoping to retire), the riskier the mix. Generally speaking, the fees are similar to other managed funds (~.35) and are attractive to investors who want to easily adjust risk. Highest returns in 2017 came from the 2055 and 2065 funds. This makes sense since they are the furthest out and equity based (no bonds). If the equities market stays strong in 2018, then the 2055 and 65 funds will remain strong. If the market is flat to down, shift investments out of 55/65 and into 15/25.
Example:
PMP 2015 fund: Largest mix: domestic bonds
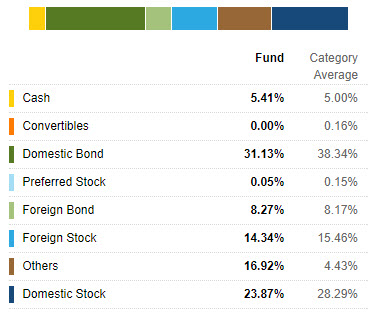
PMP 2015 Fund
PMP 2065 fund: Largest mix: domestic stock
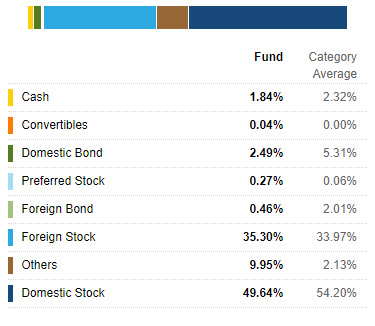
PMP 2065 Fund
The other option is the Pre-Mixed Portfolio Retirement Fund.
This fund is generally a middle-of-the road risk allocation of equal weight bonds, domestic stocks, foreign stocks, and other investments. It’s very diversified and offers a slightly better fee structure (.25% vs .35% for other target date funds). Performed worse than all others in this space in 2017, so the savings in fee is not worth the consideration.
Passively Managed Options
The best thing about these funds is the fees. At .05%-.13%, these are the best rates in this year’s 401k and simply follow the trends of the market.
Bond Index Fund
This fund follows the AGG ETF : The iShares Core U.S. Aggregate Bond ETF seeks to track the investment results of an index composed of the total U.S. investment-grade bond market.
As a general rule, if the equities market is great, the AGG will be down. If the equities market is volatile or declining, money flows into bonds. You won’t make high percentage gains here, but you’ll be able to protect some of your capital with low fees.
NOTE: The actively managed Bond Fund offers a slightly better return, but at a higher fee, so it’s a toss up unless you have a lot of money to invest. If so, then avoid the fees.
Equity Index Fund
Follows the S&P 500. You can watch SPY ETF as the benchmark. It was my favorite in 2017 and easy to understand. If the US equities market goes up, this fund goes up with very low fees.
Small / Midcap Core Index
Follows US traded equities that are not members of the S&P 500 (VXF). IWM is a good benchmark that gives you data on midcap strength. I watch the IWM and SPY to see which one makes more sense technically (the charts), but they both go where the larger market goes.
International Index
(second best 1 year performance in 401k – 28%)
Follows VEU . The investment seeks to track the performance of a benchmark index that measures the investment return of stocks of companies located in developed and emerging markets outside of the United States. News out of Japan and EMEA affect this index the most.
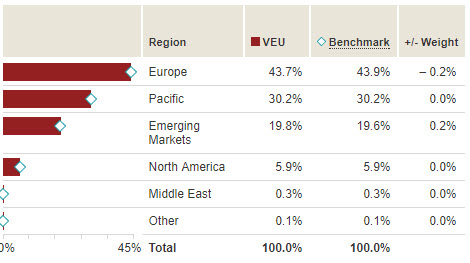
VEU
Actively Managed Options
Fees are a little higher on these, but still worth a look.
Bond Fund
Follows AGG just like the Bond Index Fund, but offers slightly better returns. With higher fees than the Index version, it’s a toss up unless you’re betting big.
Short Duration Bond
Follows the BBgBarc 1-5 Year Govt/Cr. (ISTB ETF) and largely weighted in US treasury notes. This fund is very low risk, low reward and used largely as a parking lot during down equity markets or if you’re about to retire and reducing risk.
Balanced Real Assets
Blended fun, but struggles to keep up with the benchmark. I prefer the Balanced Fund (see below).
The Fund seeks to provide a total investment return to approximate as closely as possible, before expenses, the performance of a custom index (the “Index”) over the long term. The Fund seeks to approximate its custom benchmark, which is comprise d of 15% Dow Jones U.S. Select REIT IndexSM , 25% Bloomberg Barclays Roll Select Commodity IndexSM, 25 % S&P Global LargeMidCap Commodity and Resources Index, 25% Bloomberg Barclays US Treasury Inflation Protected Securities (TIPS) Index and 10% S&P Global Infrastructure Index.
Balanced Fund
Follows the Russell 1000 ETF IWB
Balanced fund follows the 1000-largest US companies, so it’s a mix of S&P 500 and mid caps. This fund is a little less risky than focusing on large caps or mids only and easier to invest in passively in the 401k. You can think of it as a mix of US Large Cap and US Small/Mid Cap equities. I prefer it over these two.
US Large Cap Equity
Follows SPY. I don’t see a need for this fund. The Equity Index Fund matches performance with lower fees.
US Small/MID Cap Equity
This fund follows the Russell 2500 and is similar to the Small / Mid cap Core Index Fund that follows IWM, but accounts for more micro-cap stocks, which increases the beta slightly. From a performance standpoint, it does slightly better than the Core Index, but about the same performance in low volatility markets. I don’t like the fees here an tend to trade more in the passive fund.
International Equity
Follows MSCI EAFE (G). International Equity is all about Japan and EMEA. There is very little emerging markets, so the focus here is on developed regions with large trade with US. Both the US and these regions will need to show strength in order for this fund to perform. The managed International funds were very strong in 2017.
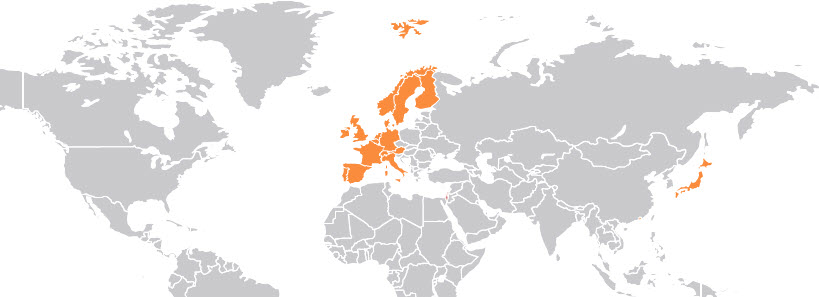
EAFE
Emerging Markets Equity
(best 1 year return in 401k – 37%)
Benchmark: MSCI Emerging Markets (N) and follows EEM ETF. Since we’re looking at emerging markets, it’s important to watch EEM. Right now, rising water is lifting all boats. If we see global weakness, this fund will get hit quickly (high beta).
Consisted of just 10 countries representing less than 1% of world market capitalization. Today the MSCI Emerging Markets Index consists of 24 countries representing 10% of world market capitalization. The Index is available for a number of regions, market segments/sizes and covers approximately 85% of the free float-adjusted market capitalization in each of the 24 countries.
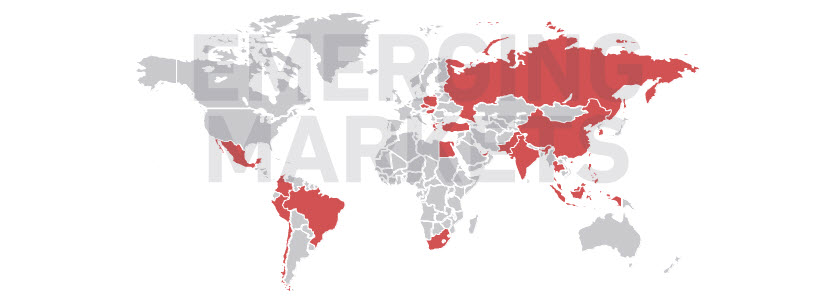
Emerging Markets

